Distribution
In this module, you can page through the bird pages or select a bird from the bird
list, listen to the sound, view the field-guide text and full Roberts' 6 text, browse
illustrations and photographs, watch a short video clip and make your own notes.
Also included on this page are updated colour-coded distribution maps (variable
density showing occurrence), alternative names, scientific names explained and alternative
bird numbers. The Bird Pages now has a new rare bird sightings database with over
4000 records.
The distribution maps have been interpreted and updated
from the Atlas of Southern African Birds, with additions for around 655 species
which occur in Mozambique, and around 200 species of rare birds, both of which were
not atlassed. The distribution maps are both colour and density-coded, and include
a colour-coded status bar, together with endemic and rare bird indicators.
Typical maps are as follows;
Resident
Breeding Migrant Non-breeding
Migrant Rare or Vagrant
The colour and density codes are indicated below.

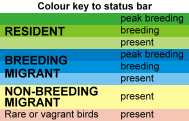
Status
The status of a species is recorded as;
- resident = green,
- breeding migrant = blue,
- non-breeding migrant = yellow,
- rare and vagrant species = pink,
- red dots = rare bird records.
Density
The colour density on a map is an indication of the relative density of occurrence,
both within a map and between maps. (ie light green on one map is equivalent to
light green on another map). Four levels of density are indicated, and are based
on the average actual reporting rate. These have been interpreted as follows;
- Abundant = greater than 50% reporting rate, up to 100%
(45 species)
- Very Common = 30-50% reporting rate (175 species)
- Common = 15-30% reporting rate (269 species)
- Uncommon = 2 -15% reporting rate (263 species)
- Rare = less than 2% (180 species)
The "break-points" have been selected on the basis
of obtaining a reasonably equal split in the number of species in the range. The
surprising factor is just how low these reporting rates are.These reporting rates
are averaged over an area and are given as a guide only.
Status Bar

The Status Bar indicates the presence of a species, as well as whether present,
breeding or peak-breeding.
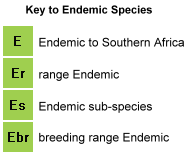
Endemic species
Endemic Species are indicated by a green square at the right-hand bottom corner
of the distribution map.
|
- E = wholly endemic species
- Er = species with range largely confined to Southern
Africa
- Es = endemic sub-species which is potentially
a full species
- Ebr = species with breeding range wholly confined
to Southern Africa.
|
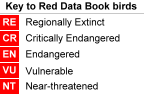
Red Data Species
Red data species are indicated by a red square in the bottom left corner of
the distribution maps. The species are those listed in one of two references: Threatened
Birds of the World, Birdlife International, 2000, and The Eskom Red Data Book
of Birds of South Africa, Lesotho and Swaziland. by Barnes, K.N.
Birdlife South Africa, 2000. Where there was conflicting criteria, the classification
in The Eskom Red Data Book of Birds of South Africa, Lesotho and Swaziland
was given preference, as it more accurately reflects the species red data status
in a Southern African context. The included text indicates the following;
|
-
RE
= regionally extinct
-
CR
= critically endangered
-
EN
= endangered
-
VU
= vulnerable
-
NT
= near threatened.
|
Examples of typical and mixed maps;
|
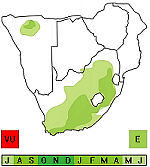
Green = Resident species
- Green square = Endemic
- Red square = South African Red Data Species
- Status bar = present, breeding, peak breeding.
|
|
|
|
|
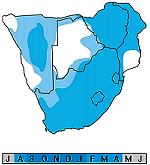
Blue = Breeding Migrant
- usually intra-African breeding migrant.
- Status bar = present, breeding, peak breeding.
|
|
|
|
|
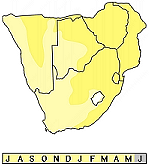
Yellow = Non-breeding Migrant.
- Palaearctic (nortern-hemisphere) migrants in summer
- Southern Ocean sea birds moving north in winter,
- non-breeding migrants from Madagascar in winter
- Status bar = present.
|
|
|
|
|
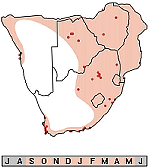
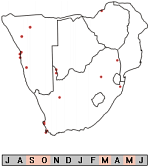
Pink = Rare Bird.
- A pink distribution indicates a rare bird It is
not equivalent to the above, which are based on distributions over a 5-year period.
It is based on rare bird records that have occurred over an extended period (sometimes
over 100 years, but most records occur within the past 20 years). It is therefore
presented as a guide as to where these rare species are likely to occur. The red
dots indicate quarter-degree-square localities in which the bird has been recorded.
- Status bar = present.
|
|
|
|
|
Vagrant Species
- A bird with so few records (usually less than 20), that
a rare bird distribution cannot be interpreted. The red dots indicate quarter-degree-square
localities in which the bird has been recorded.
- Status bar = present.
|
|
|
|
|
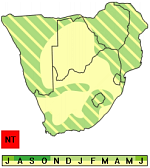
- Resident population (green stripes) augmented by non-breeding
migrants in summer. Residents more common.
- Status bar indicates present and breeding (green) and
non-breeding populations (yellow)
|
|
|
|
|
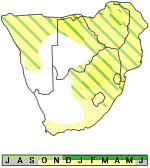
- Resident population (green stripes) augmented by non-breeding
migrants in summer. Residents less common.
- Status bar indicates present and breeding (green) and
non-breeding populations (yellow)
|
|
|
|
|
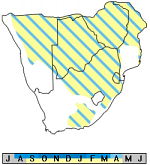
- Mixed breeding migrant (blue) and non-breeding migrant
(yellow) populations. Breeding migrants less common.
- Status bar indicates breeding (blue) and non-breeding
populations (yellow)
|
|
|
|
|
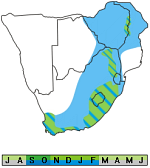
- Mixed resident (green) augmented by breeding migrant
(blue) populations. A breeding intra-african migrant with part of the poulation
remaining during the southern winter.
- Status bar indicates present and breeding (green) and
breeding migrant populations (blue)
|
|